Stock screener for traders and investors
Multi-signal scanner on several simultaneous time units
Multi-Signal Stock Screener
Filter financial products based on signals detected from key stock market indicators (Ichimoku, moving averages, MACD, momentum, etc.).
3 simultaneous timeframe
Analyze signals on the 3 main timeframes (daily, weekly, monthly), suitable for swing trading and long-term trading.
Visualization
Finally, explore and customize detailed charts displaying key indicators. Switch time units with a single click.
Signals detected by the stock screener
Ichimoku screener
The Ichimoku indicator consists of five distinct lines. The Tenkan-sen and Kijun-sen track the current price movement, while the Senkou Span A (SSA) and Senkou Span B (SSB) project market equilibrium into the future, forming the cloud’s boundaries. Finally, the last line, the Kijun-sen, reflects the current closing price projected 26 periods backward, serving as the market’s memory.
This stock screener helps identify trend reversals or continuations through the following signals:
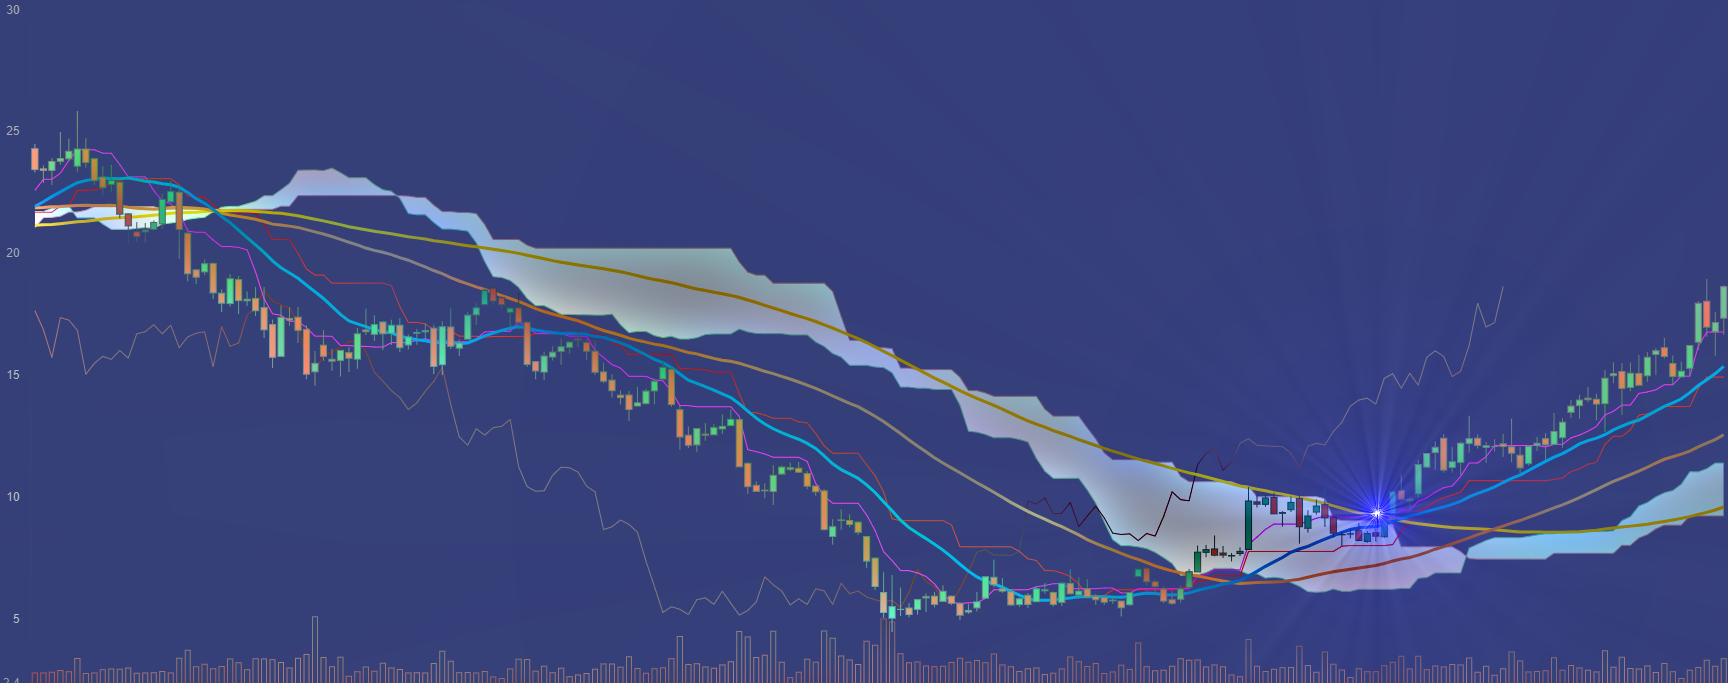
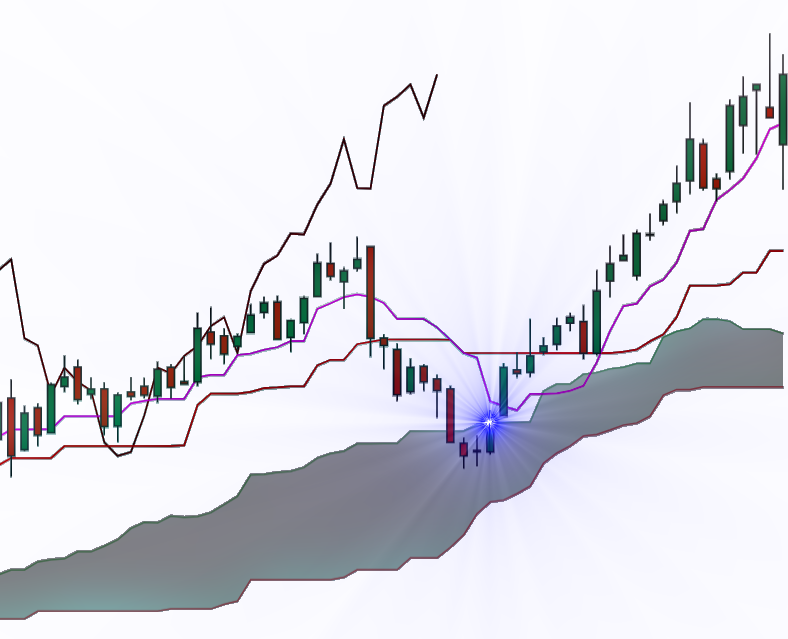
Chikou Span rebound on the price.
The Chikou Span represents the closing price shifted 26 periods backward. When it crosses a price candlestick, a rebound is possible, suggesting a potential resumption of the upward trend.
Price rebound on the cloud.
The cloud, formed by the SSA and SSB lines, statistically acts as a support, pushing prices upward and favoring a bullish trend.
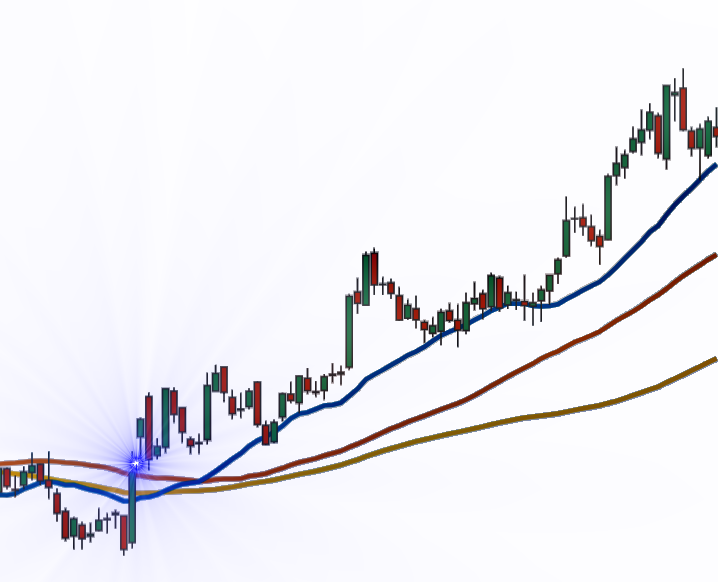
Upward crossover of the Kijun-sen above the Tenkan-sen.
The Chikou-Span, representing the closing price shifted 26 periods back, can bounce off a price candle, signaling a possible resumption of the bullish trend.
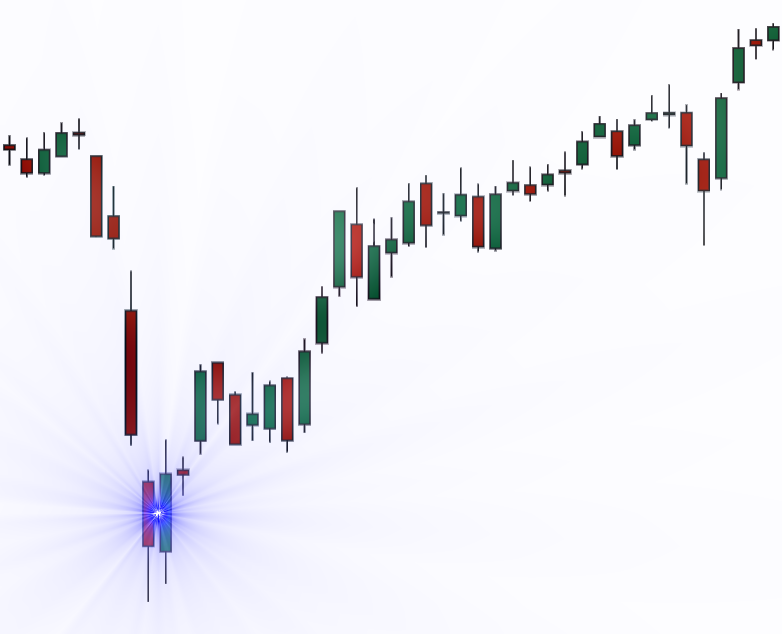
Candlestick screener
That’s why the stock and ETF screener looks for the following candlestick patterns:
bullish harami
When prices are in a downtrend, the bullish harami appears as a large bearish candle followed by a small bullish candle, which is completely contained within the previous candle.
Morning star
This figure consists of a large bearish candle, followed by a small candle separated by a gap, and then a large bullish candle, also separated by a gap.
Bullish engulfing
In a bearish trend, a small bearish candle is fully engulfed by a large bullish candle. This pattern, combined with an increase in volume, strengthens the likelihood of a trend reversal.
Bullish Piercing
A large bullish candlestick follows a large bearish candlestick. The second candlestick opens below the close of the first one, but closes above the middle of its body.
Hammer
The hammer is made up of a single candle, featuring a short body, a long lower wick, and the absence of an upper wick.
Moving average screener
The moving averages for 20, 50, and 100 periods are among the most commonly used. Visual signals can be used to spot trend reversals.
This scanner identifies the main reversal signals towards an uptrend:
- Crossover of the MA20 with the MA50, and the MA50 with the MA100.
- Reversal of a moving average.
- Rebound of the price on a moving average
Supertrend screener
The Supertrend is a trend-following technical indicator that, unlike others, incorporates volatility. It is frequently used by analysts, especially to place protective stops.
The stock screener uses the characteristics of this indicator to identify trend reversals or continuation, based on the following signals:
- SuperTrend exceeds the closing price.
- The price bounces off the SuperTrend (support).
Momentum screener
Momentum is a technical indicator belonging to the oscillator family. It is used to assess the acceleration of a bullish or bearish trend. This indicator has no fixed limits and fluctuates around the zero line. It is positive when the market is accelerating upwards and becomes negative in the opposite case.
The following signals are analyzed by the stock screener :
- Crossing above the zero line.
- Divergence from the price curve.